Learning Intelligence System - Dropout Risk Tool
A Learning Analytics Tool Evaluation
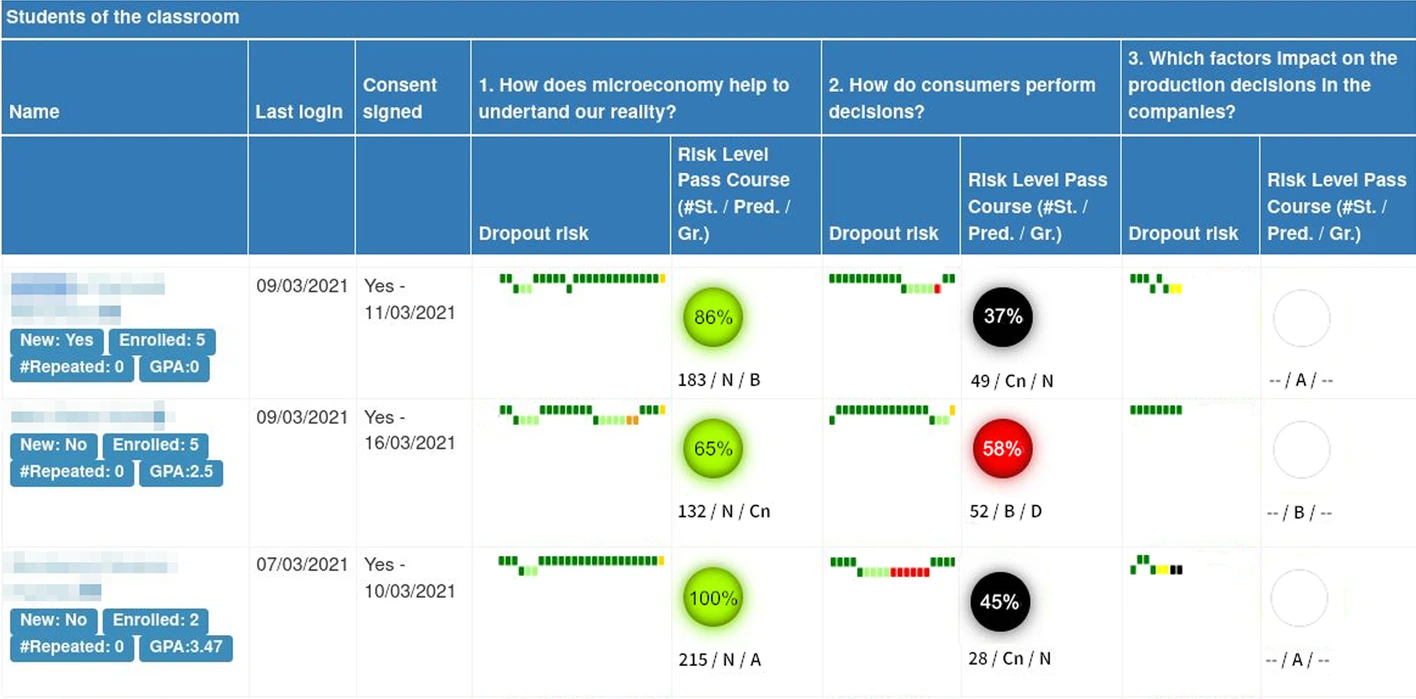
The LIS (Learning Intelligent System) develed by the UOC (Universitat Oberta de Catalunya) is an EWS (Early Warning System) that uses machine learning models trained on student data to predict student’s at risk of dropout (Bañeres et al., 2023). In this context, dropout I assumed dropout implied failure and withdrawal from the course/program, but this definition is much more granular. is defined as a learner failing to submit an assessable activity. The LIS provides teachers with a dashboard to view the risk status of all their students, and the ability to view individual students’ risk over time. Teachers can also create customized feedback that is dynamically shared with students who are identified as at risk or based on assessment results.
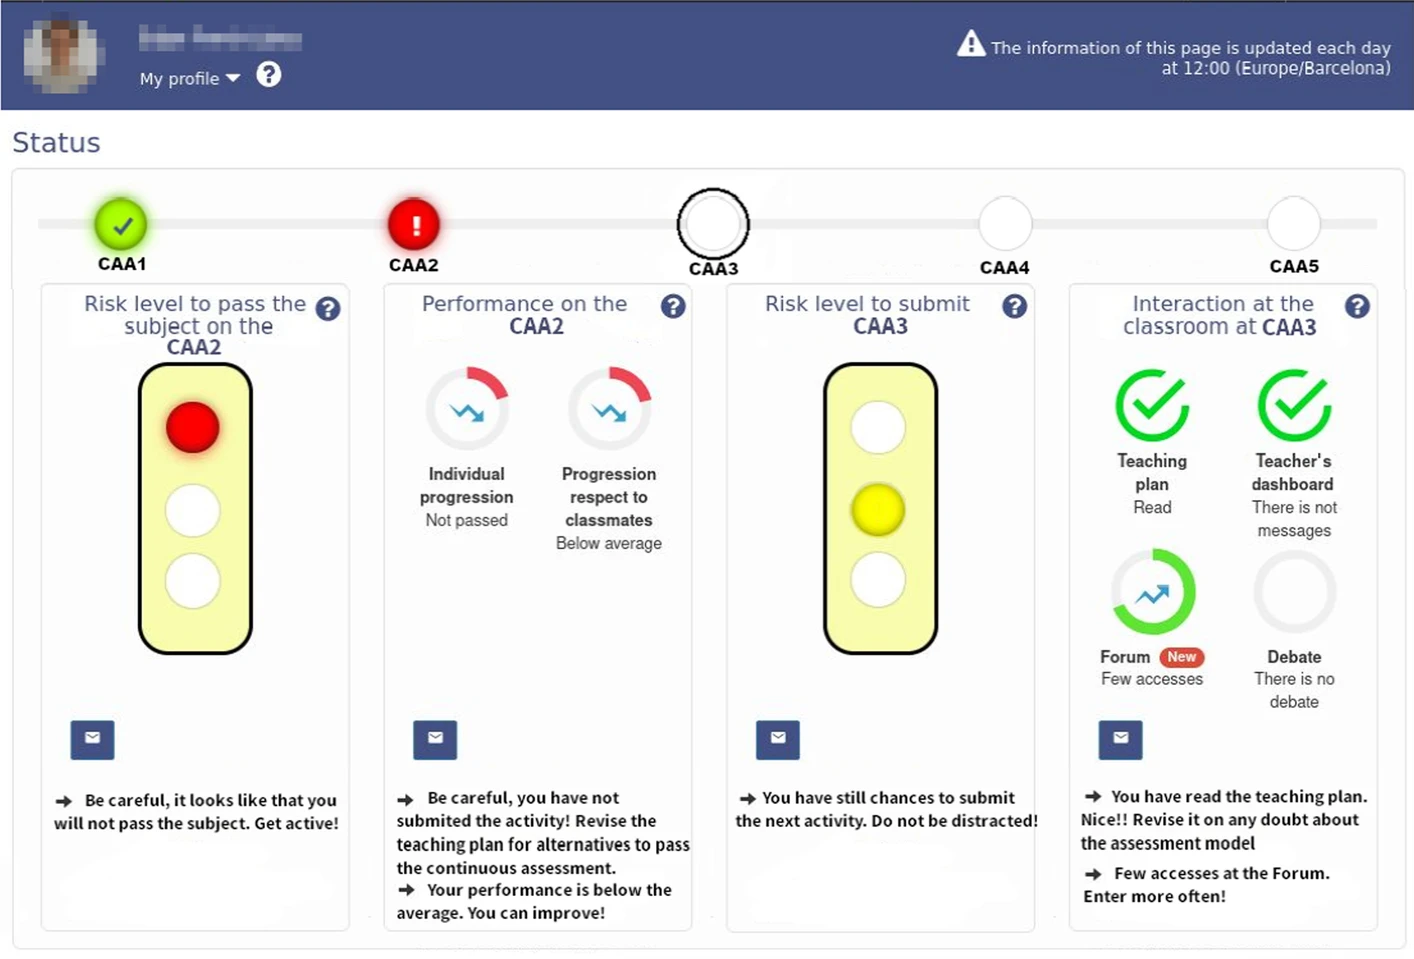
Students also benefit from this tool, with access to a dashboard that informs them of their dropout risk and shares the key metrics used in calculating that risk, including their assessment performance, the likelihood of them passing the course, and their interaction in the LMS.
The evaluation of this tool will be performed using the EFLA (Evaluation Framework for Learning Analytics).
Data
For this LA tool it is clear what data is being collected
Learner - 4/10- It isn’t fully clear where the data is coming from that is dictating my predictions.
- Yes, the dashboard makes it apparent that assignment scores play a key part in it, but one is left wondering what additional metrics may be used from within and outside of the LMS. What historical data is used to train the models, and what data of mine will be used to train subsequent models?
- The tool provides clear and examinable information on its data sources and data manipulation, with an extensive view on the predictive models being used, the configuration of sub-models, and surfaced assessment data.
- As an educator, I am more likely to be informed about the extensive documentation and background of the tool.
For this LA tool it is clear why the data is being collected
Learner - 10/10- The purposes of the data collection for this LA tool are transparent. As a learner, I receive access to the insights this tool generates.
- The tool keeps me informed about my performance and dropout risk, and provides actionable feedback.
- The data collection for this tool is transparent and its reasoning well communicated.
- Model training and model application have clear data sources and roles.
Awareness & Reflection
Learner Questions
This LA tool makes me aware of my current learning situation
Learner - 7/10- The tool helps me gauge my current performance based on historical course data.
- I can easily identify whether it is predicted I will pass the course based on my current performance.
- I receive personalized interventions if I’m at risk or falling behind.
This LA tool makes me forecast my possible future learning situation given my (un)changed behaviour
Learner - 10/10- The tool clearly highlights the potential risk or success of my continued behaviour.
- Personalized feedback further emphasizes this forecast.
This LA tool stimulates me to reflect on my past learning behaviour
Learner - 3/10- I may consider how I received a certain risk level, but the tool is primarily focused on my future performance.
- The tool does not overtly provide a historical look at my learning behaviour.
This LA tool stimulates me to adapt my learning behaviour if necessary
Learner - 10/10- Through the feedback system and the personal dashboard, I am prompted to evaluate my learning behaviour and make any adjustments as required.
Teacher Questions
This LA tool makes me aware of my students’ current learning situation
Teacher - 6/10- The tool demonstrates my students’ assessment performance and their associated dropout risk.
- It does not pull from any other learning-related metrics.
- For rote assessment, the tool increases my awareness of my students’ learning situation.
This LA tool makes me forecast my students’ possible future learning situation given their (un)changed behaviour
Teacher - 8/10- The tool allows me to focus on at-risk students and nurture successful students.
- I am made aware of potential future risks if behaviour is unchanged.
This LA tool stimulates me to reflect on my past teaching behaviour
Teacher - 7/10- While I am limited to my assessment-based indicators, the interactive Sankey diagram provided by the dashboard allows me to view how my teaching might be influencing individual students.
This LA tool stimulates me to adapt my teaching behaviour if necessary
Teacher - 3/10- The tool emphasizes individual interventions rather than shifts in teaching behaviour.
Impact
Learner Questions
This LA tool stimulates me to study more efficiently
Learner - 9/10- By providing me with a clear grade range to stay outside of dropout risk, I am able to more effectively allocate study time towards each assessment.
This LA tool stimulates me to study more effectively
Learner - 6/10- The automated feedback I receive from the tool points me in the right direction for studying.
- Unfortunately, I only receive this feedback after submission.
Teacher Questions
This LA tool stimulates me to teach more efficiently
Teacher - 7/10- By automating personalized learner feedback, I am able to engage efficiently with students who might not otherwise receive individualized attention but who would benefit the most from it.
- I can place special attention on student’s at risk of dropping out.
This LA tool stimulates me to teach more effectively
Teacher - 4/10- The tool does not contribute significantly to the effectiveness of my teaching.
- Revealing large trends about drop-out risk within my class may impact how I teach.
Trust
This LA tool produces insights that I can trust
Student - 7/10- The tool tells me what score I should aim for on each assessment.
- I receive appropriate feedback based on my performance.
- This isn’t a commercial product, I am comfortable with the tool’s usage of my data.
- The tool warns me when a prediction may be low-accuracy, but prompts me anyways just in case.
- This tool is supported by accompanying research from the institution.
- I don’t know enough about the statistical models to refute or support them myself.
- Consequence of error in the tool could be significant.
Critical Evaluation
I selected the LIS (Learning Intelligent System) because Early Warning Systems (EWS) are intriguing and an intuitively utilitarian application of learning analytics. Leveraging a variety of learner data to identify students at risk of dropping out and preparing interventions is an undeniably attractive (‘shiny’, if you will) service. Purdue’s Course Signals tool initially caught my eye, and the controversies surrounding it immediately lead me through an exploration of EWS systems. I came across Macfadyen and Dawson (2010) being cited in EWS research - I can't help but wonder whether, as a learner in this course, I am the subject of an EWS in some form!
The papers describing this tool are numerous, but Bañeres et al. (2019) was particularly compelling to me due to its systematic explanation of the tool’s functions, from theory, to code, to infrastructure. They show how the sausage gets made. This is in contrast to many of the more “productized” learning analytics offerings, which are often blackboxes of endless telemetry and hustling sales departments. Instead, Bañeres et al. demonstrate the creation of a simple EWS that gradually increases in capability and complexity.
I utilized a pseudo-EFLA (Evaluation Framework for Learning Analytics) approach for evaluating the LIS. Scheffel (2017) introduces EFLA as a survey that itself generates quantitative data for further analysis. In the study, participants provide scoring, but are also given the option to provide comments. Other applications of the EFLA, such as Yan et al. (2024), place further emphasis on this qualitative aspect. Completing this evaluation as an individual detracts from the framework’s quantitative value, thus I aimed to provide a deeper qualitative view to the EFLA questionnaire. Critics of the EFLA note its failure to measure trust and accuracy of a Learning Analytics tool, which is why I chose to include an additional indicator to my evaluation that covers such a question (Jivet et al., 2018).
The UOC’s EWS tool, referred to as the LIS (Learning Intelligent System) is neither a commercial product nor an open-source project, but instead lies in the realm of a proprietary research tool. Its creators are researchers, and its institutional funding is presumably motivated by the desire to benefit UOC and its students. Essentially every detail of the tool’s functionality is outlined in the multiple publications on the LIS’s functions (Bañeres et al., 2019; Bañeres et al., 2020; Rodriguez et al., 2022; Bañeres et al., 2023), as well as more publicly through direct articles by UOC (López, 2023). This transparency differentiates it from many other tools in that it is abundantly clear what data is being collected and for what purposes. How the tool itself communicates this transparency to its non-research users though is less overt. While teachers and UOC staff are more likely to be aware of the tool’s model development, data sources, and general research, it is not clear that the tool itself integrates any communications on this subject to students. It cannot be assumed that students would seek this out independently, and there is no explicit discussion of non-research subject consent in the paper.
Specifically, the tool collects and leverages:
- anonymized course assessment data on which it trains its models (2019, 2020)
- student assessment results and metrics
- student course enrolment and associated administrative information
- student grade point average
- click-stream data indicating
- course access
- resources and tools used
- number of messages read
- customized teacher feedback
Given the highly-publicized nature of the LIS, there are few questions left unanswered regarding its functioning. Because of its proprietary usage though, trust in the EWS tool is complex. It has not had to prove itself in the public sphere. Users must trust the modelling and the research behind it, but to my knowledge, there has been no 3rd party research performed on the LIS. This positions it for the very same criticism as Perdue’s Course Signals, where tenuous internal research about the tool’s actual effectiveness was called into question (Feldstein, 2013). If the tool were to be wrong in any way, the results could carry significant negative impact on learners through a misdirection of teaching resources or a direct undermining of learner confidence. I could find no indication that the LIS was being positioned for public distribution, beyond a mention of collaboration with the European Patent Office (Rodríguez, 2022).
From 2019 to 2023, the LIS evolved from a relatively simple tool that solely leveraged assessment data to make drop-out predictions, to a much more comprehensive early warning system that leverages extensive learning data. An early iteration solely relied on historical assessment data to project dropout risk which it could only generate once per assessment (Bañeres, 2019). By 2023, the system was generating daily predictions by ingesting a variety of relevant LMS data (Bañeres, 2023). The LIS is particularly compelling in its ability to immediately provide learner’s with actionable feedback, nudging them away from potential risk/dropout (Bañeres, 2022). I feel as though this system is an ideal demonstration of the iterative development of applied learning analytics. While I am not aware of dropout being a significant concern in my local context, I believe the personalized feedback system is cutting-edge innovation, and something I would be eager to integrate or recommend. The way the LIS tool provides utility and insight to teachers while engaging student’s as active participants makes it a compelling example of an agentic approach to LA collaboration.
References
Arnold, K., & Pistilli, M. (2012). Course signals at Purdue: Using learning analytics to increase student success. ACM International Conference Proceeding Series. https://doi.org/10.1145/2330601.2330666
Bañeres, D., Rodríguez, M. E., Guerrero-Roldán, A. E., & Karadeniz, A. (2020). An Early Warning System to Detect At-Risk Students in Online Higher Education. Applied Sciences, 10(13), Article 13. https://doi.org/10.3390/app10134427
Bañeres, D., Rodríguez-González, M. E., Guerrero-Roldán, A.-E., & Cortadas, P. (2023). An early warning system to identify and intervene online dropout learners. International Journal of Educational Technology in Higher Education, 20(1), 3. https://doi.org/10.1186/s41239-022-00371-5
Baneres, D., Rodríguez-Gonzalez, M. E., & Serra, M. (2019). An Early Feedback Prediction System for Learners At-Risk Within a First-Year Higher Education Course. IEEE Transactions on Learning Technologies, 12(2), 249–263. IEEE Transactions on Learning Technologies. https://doi.org/10.1109/TLT.2019.2912167
Feldstein, M. (2013, November 3). Course Signals Effectiveness Data Appears to be Meaningless (and Why You Should Care). E-Literate. https://eliterate.us/course-signals-effectiveness-data-appears-meaningless-care/
Jivet, I., Scheffel, M., Specht, M., & Drachsler, H. (2018). License to evaluate: Preparing learning analytics dashboards for educational practice. Proceedings of the 8th International Conference on Learning Analytics and Knowledge, 31–40. https://doi.org/10.1145/3170358.3170421
López, A. (2023). AI to detect and intervene early with at-risk students. https://www.uoc.edu/en/news/2023/209-AI-detects-students-at-risk-dropping-out
Macfadyen, L. P., & Dawson, S. (2010). Mining LMS data to develop an “early warning system” for educators: A proof of concept. Computers & Education, 54(2), 588–599. https://doi.org/10.1016/j.compedu.2009.09.008
Rodríguez, L. (2022). Personalized teaching for the European Patent Office. https://www.uoc.edu/en/news/2022/248-european-patent-office
Rodriguez, M. E., Guerrero-Roldán, A. E., Baneres, D., & Karadeniz, A. (2022). An Intelligent Nudging System to Guide Online Learners. The International Review of Research in Open and Distributed Learning, 23(1), 41–62. https://doi.org/10.19173/irrodl.v22i4.5407
AI Usage
I used Antrophic’s Claude 3.7 Sonnet during this assignment, and opted to take notes on my various applications of the tool:
- Used to determine how to apply the EFLA framework as an individual as opposed to a survey
- Used to generate a markdown template for completing the EFLA framework
- Helped interpet some of the more complex passages of the LIS research papers
- Used to determine optimal assignment structure and layout
- Fixed some CSS formatting on this webpage
- Answered some APA 7th edition formatting questions
- Provided feedback on phrasing of a complex sentence