Contingency Analysis
A Learning Analytics Method Summary
Summary
Interaction in the online environment is a mess of synchronous, asynchronous, and semi-synchronous communication and activities taking place in instant message chats, discussion forums, and many other modalities - all of which produce analytics data in different forms. Analyzing interaction in such an environment, with such a wide array of different data, represents a significant challenge. Individual interactions between learners can be quantified and statistically analyzed, but this fails to capture the “path” of interconnected interactions which occurred before and after. How learners leverage prior interaction to enhance or inform their future interaction is at the heart of contingency analysis (Suthers, 2010). It is a method for researchers to map learner interactions and relationships in an online community across various events, allowing for the sequences of learning interaction within the community to be more effectively analyzed, and thus provide greater insight and contextualization to individual or groups of interactions.
Example
Let’s imagine an online course, there is a module with several PDF readings, a collaborative wiki, a discussion board, and a final written submission. Each of these events can produce analytics data individually, but connecting these experiences and tracing the pathway of interactions between learners is the subject of contingency analysis. Contingency graphs are an abstract representation of this interaction path, illustrating the chronological series of events over time (Suthers, 2010). As such they are a fundamental tool in contingency analysis, allowing for key events and contingencies from learning data to be identified.
In our example, a series of events could be learners downloading the PDF, editing the wiki, writing a discussion post, and completing a final submission. All standard online course actions. A contingency analysis would involve identifying which of these events were informed by, or reliant, on previous events. Through this analysis, a researcher could identify patterns of interactions and events between learners and between learners and content.
Perhaps we want to analyze the origins of a similar insight noted by two learners in their final submission. Contingency analysis might trace this statement to a post made by a learner. The post was on the subject of a wiki entry they had made, which another learner had edited and enhanced. The wiki entry was written by the learner based on insights from one of the course’s PDF readings. A very short and simplified contingency graph of this scenario might look like this Made using draw.io:
.png)
My naive implementation of a contingency graph
This graph would assist in the analysis, as it reveals a pattern of interaction and collaboration between two learners that wouldn’t otherwise have been apparent looking at any individual interaction. Suthers et al. (2010) provides much larger-scale examples of contingency graphing in Fig. 7 and Fig. 8. No high resolution image of Fig 8. could be sourced, but it illustrates the potential scale well.
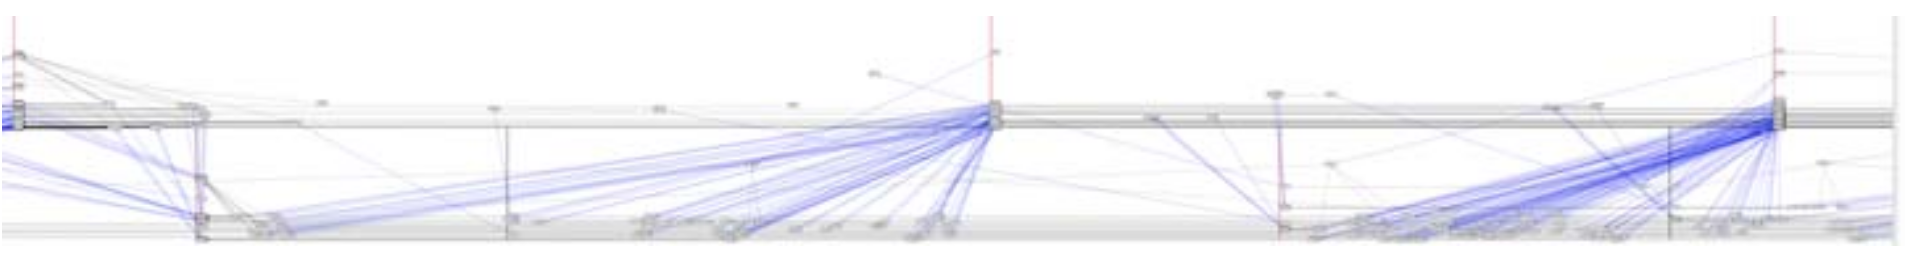
Fig. 7 A 20-minute portion of an automatically constructed contingency graph
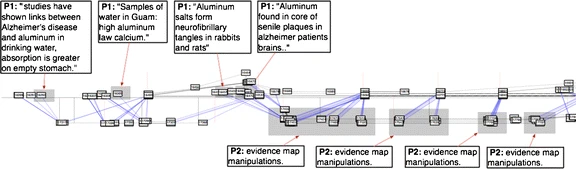
Fig 8. Information sharing by P1 followed by systematic graph manipulations by P2
What kind of learning questions could this method help answer?
Contingency analysis lends itself well to the mapping of conversations and the exchange of ideas that take place through discussion posts. Even threaded discussion posts are not perfectly linear, turn-taking exchanges of information. A contingency analysis would help identify patterns in discussion and interaction that might otherwise be difficult to ascertain from raw data. Questions such as “which learners are making contributions that other learner’s are carrying forward in their learning?” and “which learning materials are learner’s referencing in the formation of their discussions?” could be assisted through the performance of contingency analysis.
Suthers et al. (2010) demonstrates the application of contingency analyses on non-verbal interaction in a collaborative online tool. Their analysis reveals one learner constructing information, and at a glance, serving as the primary contributor. But the graph reveals the second learner performing extensive arranging and manipulation of these contributions. This capability would allow researchers to answer questions such as “how are learner’s interacting and contributing beyond overt textual communication?”
The automated construction of contingency graphs through natural language processing tools means that large sets of interaction data can be analyzed, allowing researchers to identify and focus on areas of high interaction and discussion.
Reference
Suthers and Desatio (2012) provides an approachable introduction to the complexities of contingency analysis, and is the ideal starting point for exploring the method.
AI Statement
I used Anthropic’s Claude initially to help me figure out what contingency analysis actually entails. It led me entirely astray, equating contingency analysis with the common statistical tool of contingency tables. I also used Consensus to help find any publications on contingency analysis in learning analytics, but similarly, it pointed me exclusively towards contingency table related research and contingency as it relates to power grids. Contingency analysis appears to be a relatively niche method, which may explain these failures. I only used AI to help format this webpage after that.
References
Hoppe, H. U., Göhnert, T., Charles, C., & Steinert, L. (2014). A Web-based Tool for Communication Flow Analysis of Online Chats. CEUR Workshop Proceedings. 1137.
Hoppe, U. (2017). Computational Methods for the Analysis of Learning and Knowledge Building Communities. In C. Lang, G. Siemens, A. Wise, & D. Gasevic (Eds.), The Handbook of Learning Analytics (pp. 22–33). Society for Learning Analytics Research (SoLAR). https://www.solaresearch.org/publications/hla-17/hla17-chapter2/
Suthers, D. D., & Desiato, C. (2012). Exposing Chat Features through Analysis of Uptake between Contributions. 2012 45th Hawaii International Conference on System Sciences, 3368–3377. https://doi.org/10.1109/HICSS.2012.274
Suthers, D. D., Dwyer, N., Medina, R., & Vatrapu, R. (2010). A framework for conceptualizing, representing, and analyzing distributed interaction. International Journal of Computer-Supported Collaborative Learning, 5(1), 5–42. https://doi.org/10.1007/s11412-009-9081-9